
Evertune
Evertune AI Module
By default, the Evertune AI feature is disabled in Flightdeck. To begin using it, we first need to enable the tool from the settings panel. When the feature is disabled, the Evertune section displays a message indicating that it is not currently active and prompts us to configure it through Settings.
How We Enable the Feature
| 1. Click on the Reports menu from the side navigation. | 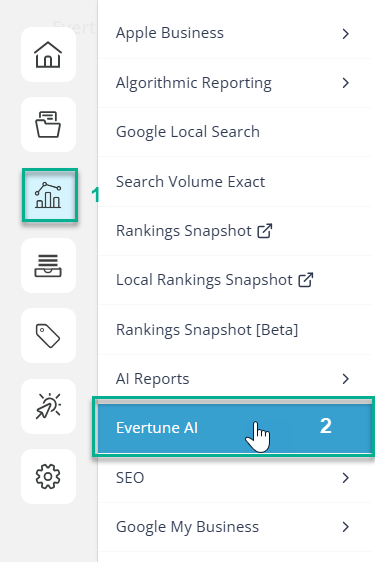 |
| 2. Click on Evertune AI menu item. |
- We click the Settings button located in the top-right corner of the Evertune section.
- A side panel titled Evertune AI Settings opens.
- In the panel, we locate the Enable/Disable Tool checkbox.
- We select the checkbox to enable the Evertune AI feature.
- Once enabled, we proceed with the required configuration, such as selecting the Brand Name.
- We click Save to apply the changes.
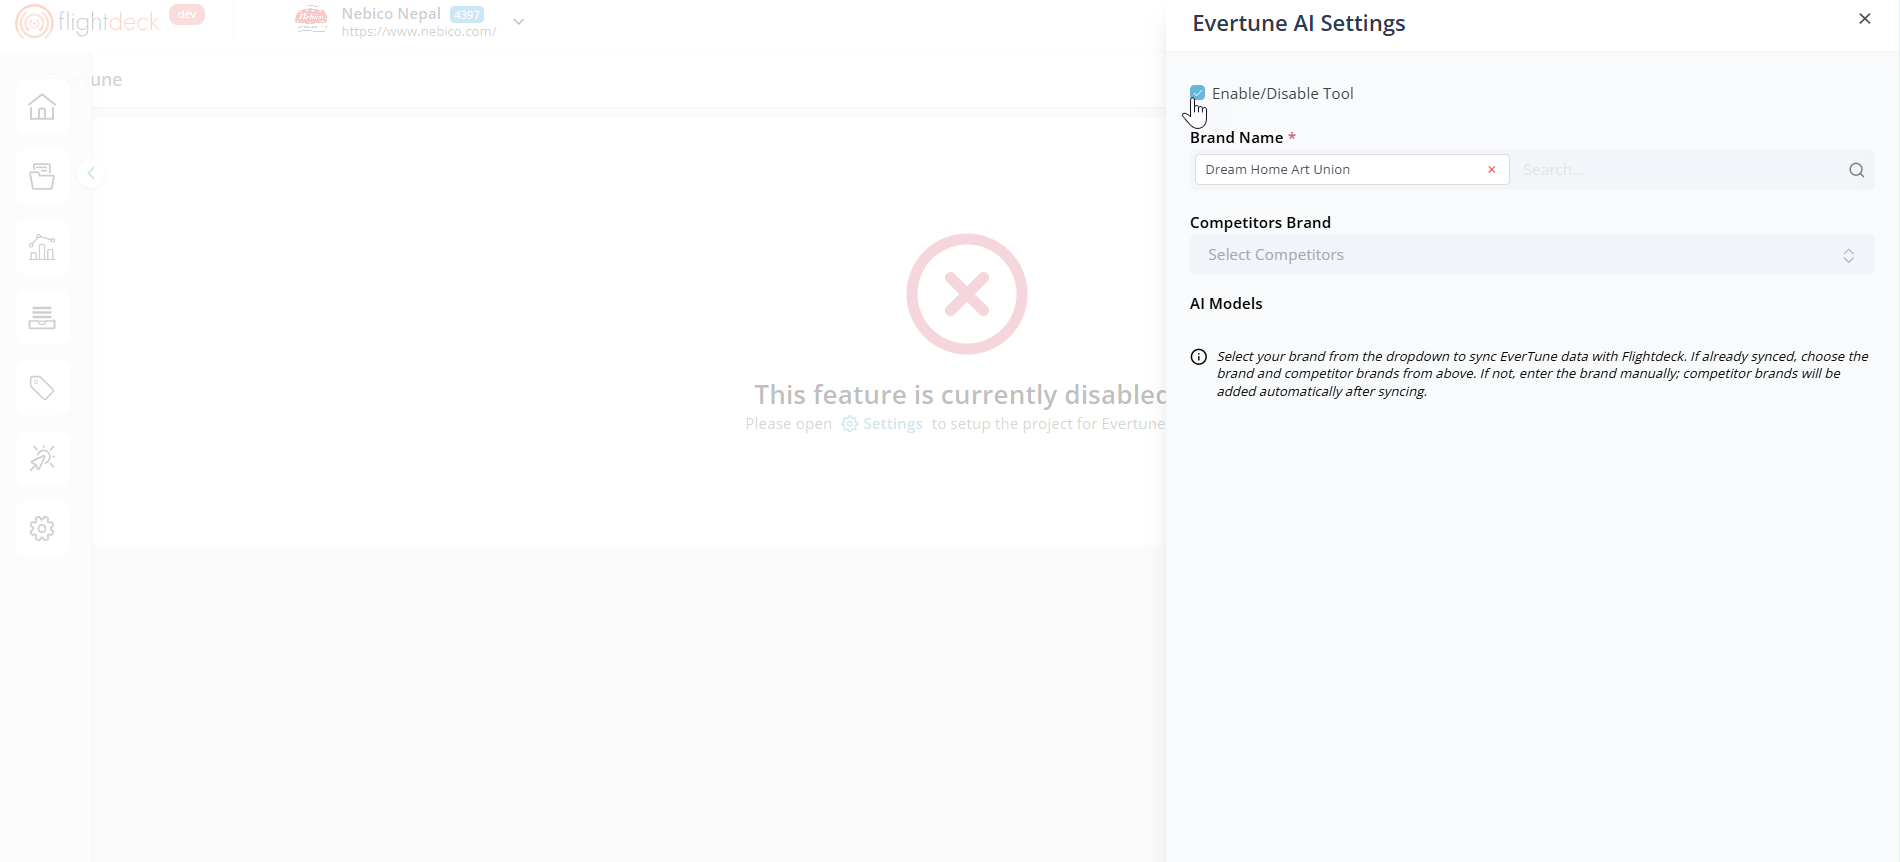
If the tool remains disabled, the Evertune interface is not accessible. Once we enable and configure it, the system begins synchronizing the selected brand data with FlightDeck.
Configuring Brand and Competitors
After enabling the Evertune AI tool, additional configuration options become available in the Evertune AI Settings panel.
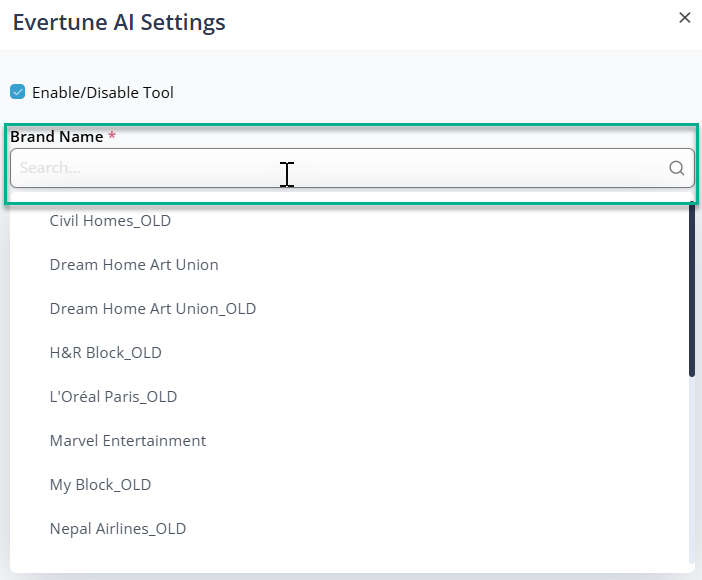
We use the Brand Name field to select the primary brand that will be synchronized with Evertune AI. Once the brand is selected, we can add competitor brands in the Competitor Brands section.
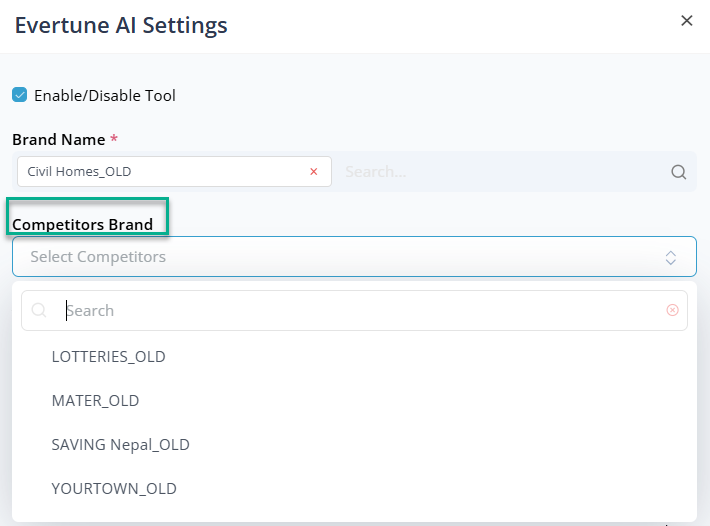
These competitors are used for comparison and analysis within Evertune insights. We can select multiple competitor brands, which appear in a list where we can review or remove them as needed.
AI Models
The AI Models section displays the models used to generate insights and analysis within Evertune.
These models operate in the background to process brand-related data and generate the visual insights displayed across the dashboard.
Saving the Configuration
After selecting the brand and competitor brands, we click Save to apply the configuration.
Once saved, the system synchronizes the selected brand data and begins displaying insights within the Evertune dashboard.
Note :
The data displayed in the Evertune dashboard reflects the selected brand and competitor configuration. As a result, insights may vary depending on the client or project being analyzed.
Global Filter
The Global Filter in Evertune allows us to refine and control the dataset used across the module.
By applying these filters, we can narrow down insights to specific brands, markets, AI models, and timeframes, ensuring that the results reflect the exact scope we want to evaluate.
This filtering layer acts as the foundation for all insights generated within Evertune. Once applied, the selected filters influence the data displayed across sections such as Word Association, AI Brand Index, and Consumer Preferences.
Filter Options
Category
We define the industry or segment under analysis. This ensures that results are contextualized within the selected market space.
Brands
We can select one or multiple brands for comparison, allowing us to evaluate how different brands perform within the same category.
Model
We specify the AI model used to generate and analyze insights, enabling evaluation based on a particular model’s interpretation.
Country
We filter results by geographic market to ensure insights reflect brand perception within a specific region.
Date Range
We define the time period for analysis, allowing us to track trends and performance over a selected timeframe.
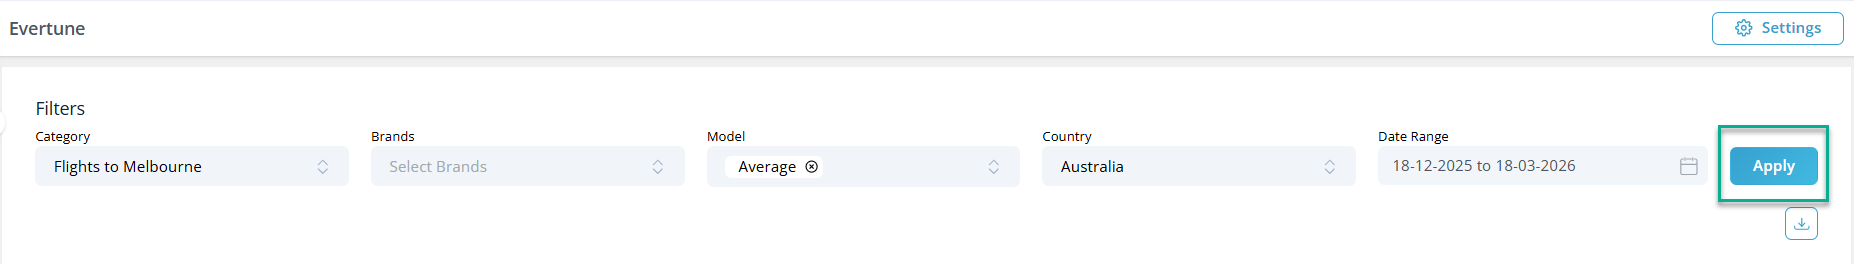
Apply
Once we configure the desired filters, we click Apply to update insights across the module.
Note: Download Presentation (PPT)
The Download option in the Global Filter generates a PowerPoint presentation based on the applied filters.
Once we select parameters such as Category, Brands, Model, Country, and Date Range and click Apply, the system uses this data to create the presentation. A confirmation pop-up appears, allowing us to download the PPT.
This ensures the exported presentation is fully aligned with the current filtered analysis and ready for sharing.
Word Association
The Word Association view helps us understand how AI commonly describes selected brands within a specific category.
It highlights frequently associated keywords, their sentiment, and how these associations evolve over time. This allows us to evaluate brand perception and compare how different brands are represented in AI-generated responses.
The insights shown in this view are driven by the Global Filters applied at the top of the page.
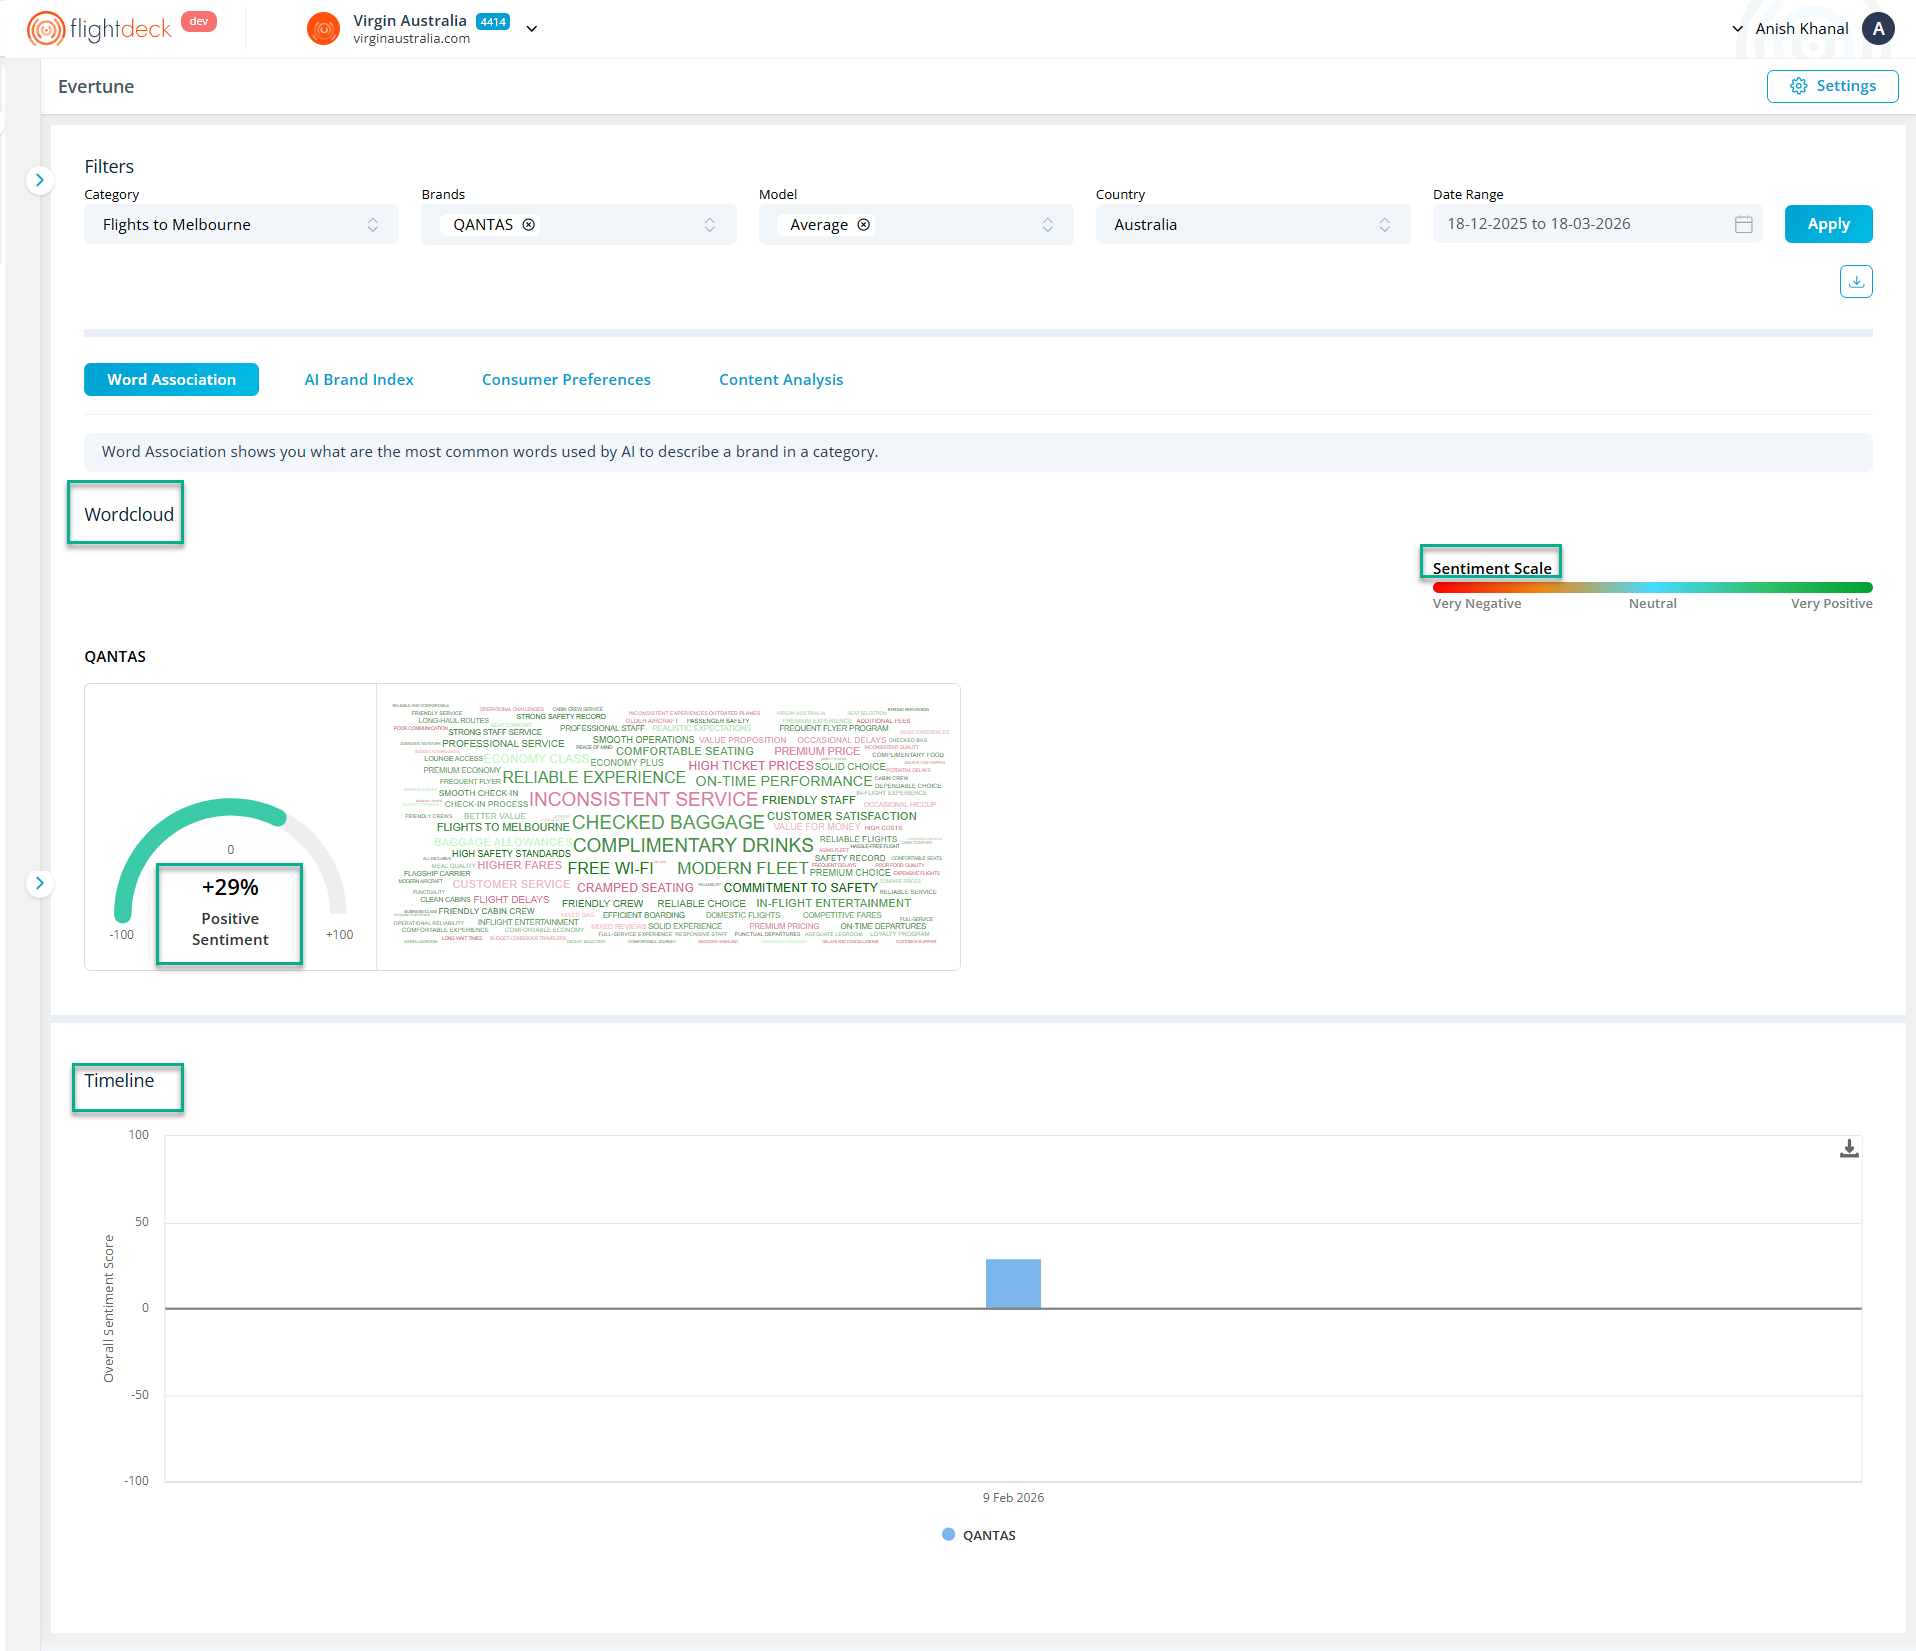
Word Cloud
The Word Cloud visualizes the most common words associated with each selected brand.
Each keyword represents how AI frequently describes the brand in relation to the selected category.
We interpret the visualization using two key elements:
- Word Size indicates the strength of the AI association score, where larger words represent stronger associations.
- Word Color reflects the sentiment score of the keyword, based on the sentiment scale displayed on the page.
When we select multiple brands, a separate Word Cloud appears for each brand, allowing us to compare how AI associates keywords across brands.
Sentiment Indicator
Next to each Word Cloud, we see a sentiment gauge that summarizes the overall sentiment derived from the associated keywords.
The score ranges from negative to positive, helping us quickly understand the overall tone of AI-generated brand associations.
Sentiment Scale
The sentiment scale provides a visual reference for how keyword colors map to sentiment levels, ranging from very negative to very positive.
This helps us interpret the tone of keywords displayed in the Word Cloud more accurately.
Timeline
The Timeline chart displays how sentiment for selected brands changes over time.
Each data point represents sentiment values recorded on dates where data is available within the selected date range. This allows us to observe shifts in brand perception and compare sentiment trends across brands over time.
AI Brand Index
Metric Selection
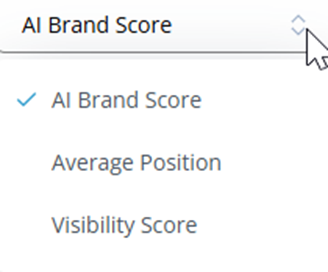
We can use the metric dropdown selector (top-right of each section) to switch between different performance metrics:
- AI Brand Score – Represents how strongly a brand is recalled or recommended by AI
- Average Position – Indicates the average ranking position of a brand in AI-generated responses
- Visibility Score – Reflects how frequently a brand appears across AI outputs
Note : Changing the selected metric dynamically updates all values and visualizations within its relevant section.
The AI Brand Index measures how likely a brand is to be recognized or recommended by AI models within a selected category.
The insights in this section are driven by the Global Filters applied at the top of the page.
Accessing AI Brand Index
- From the module tabs, select AI Brand Index
- The section opens with two sub-tabs:
- Overview
- By Brand Vector
Overview
The Overview section provides a high-level summary of brand performance based on the selected filters.
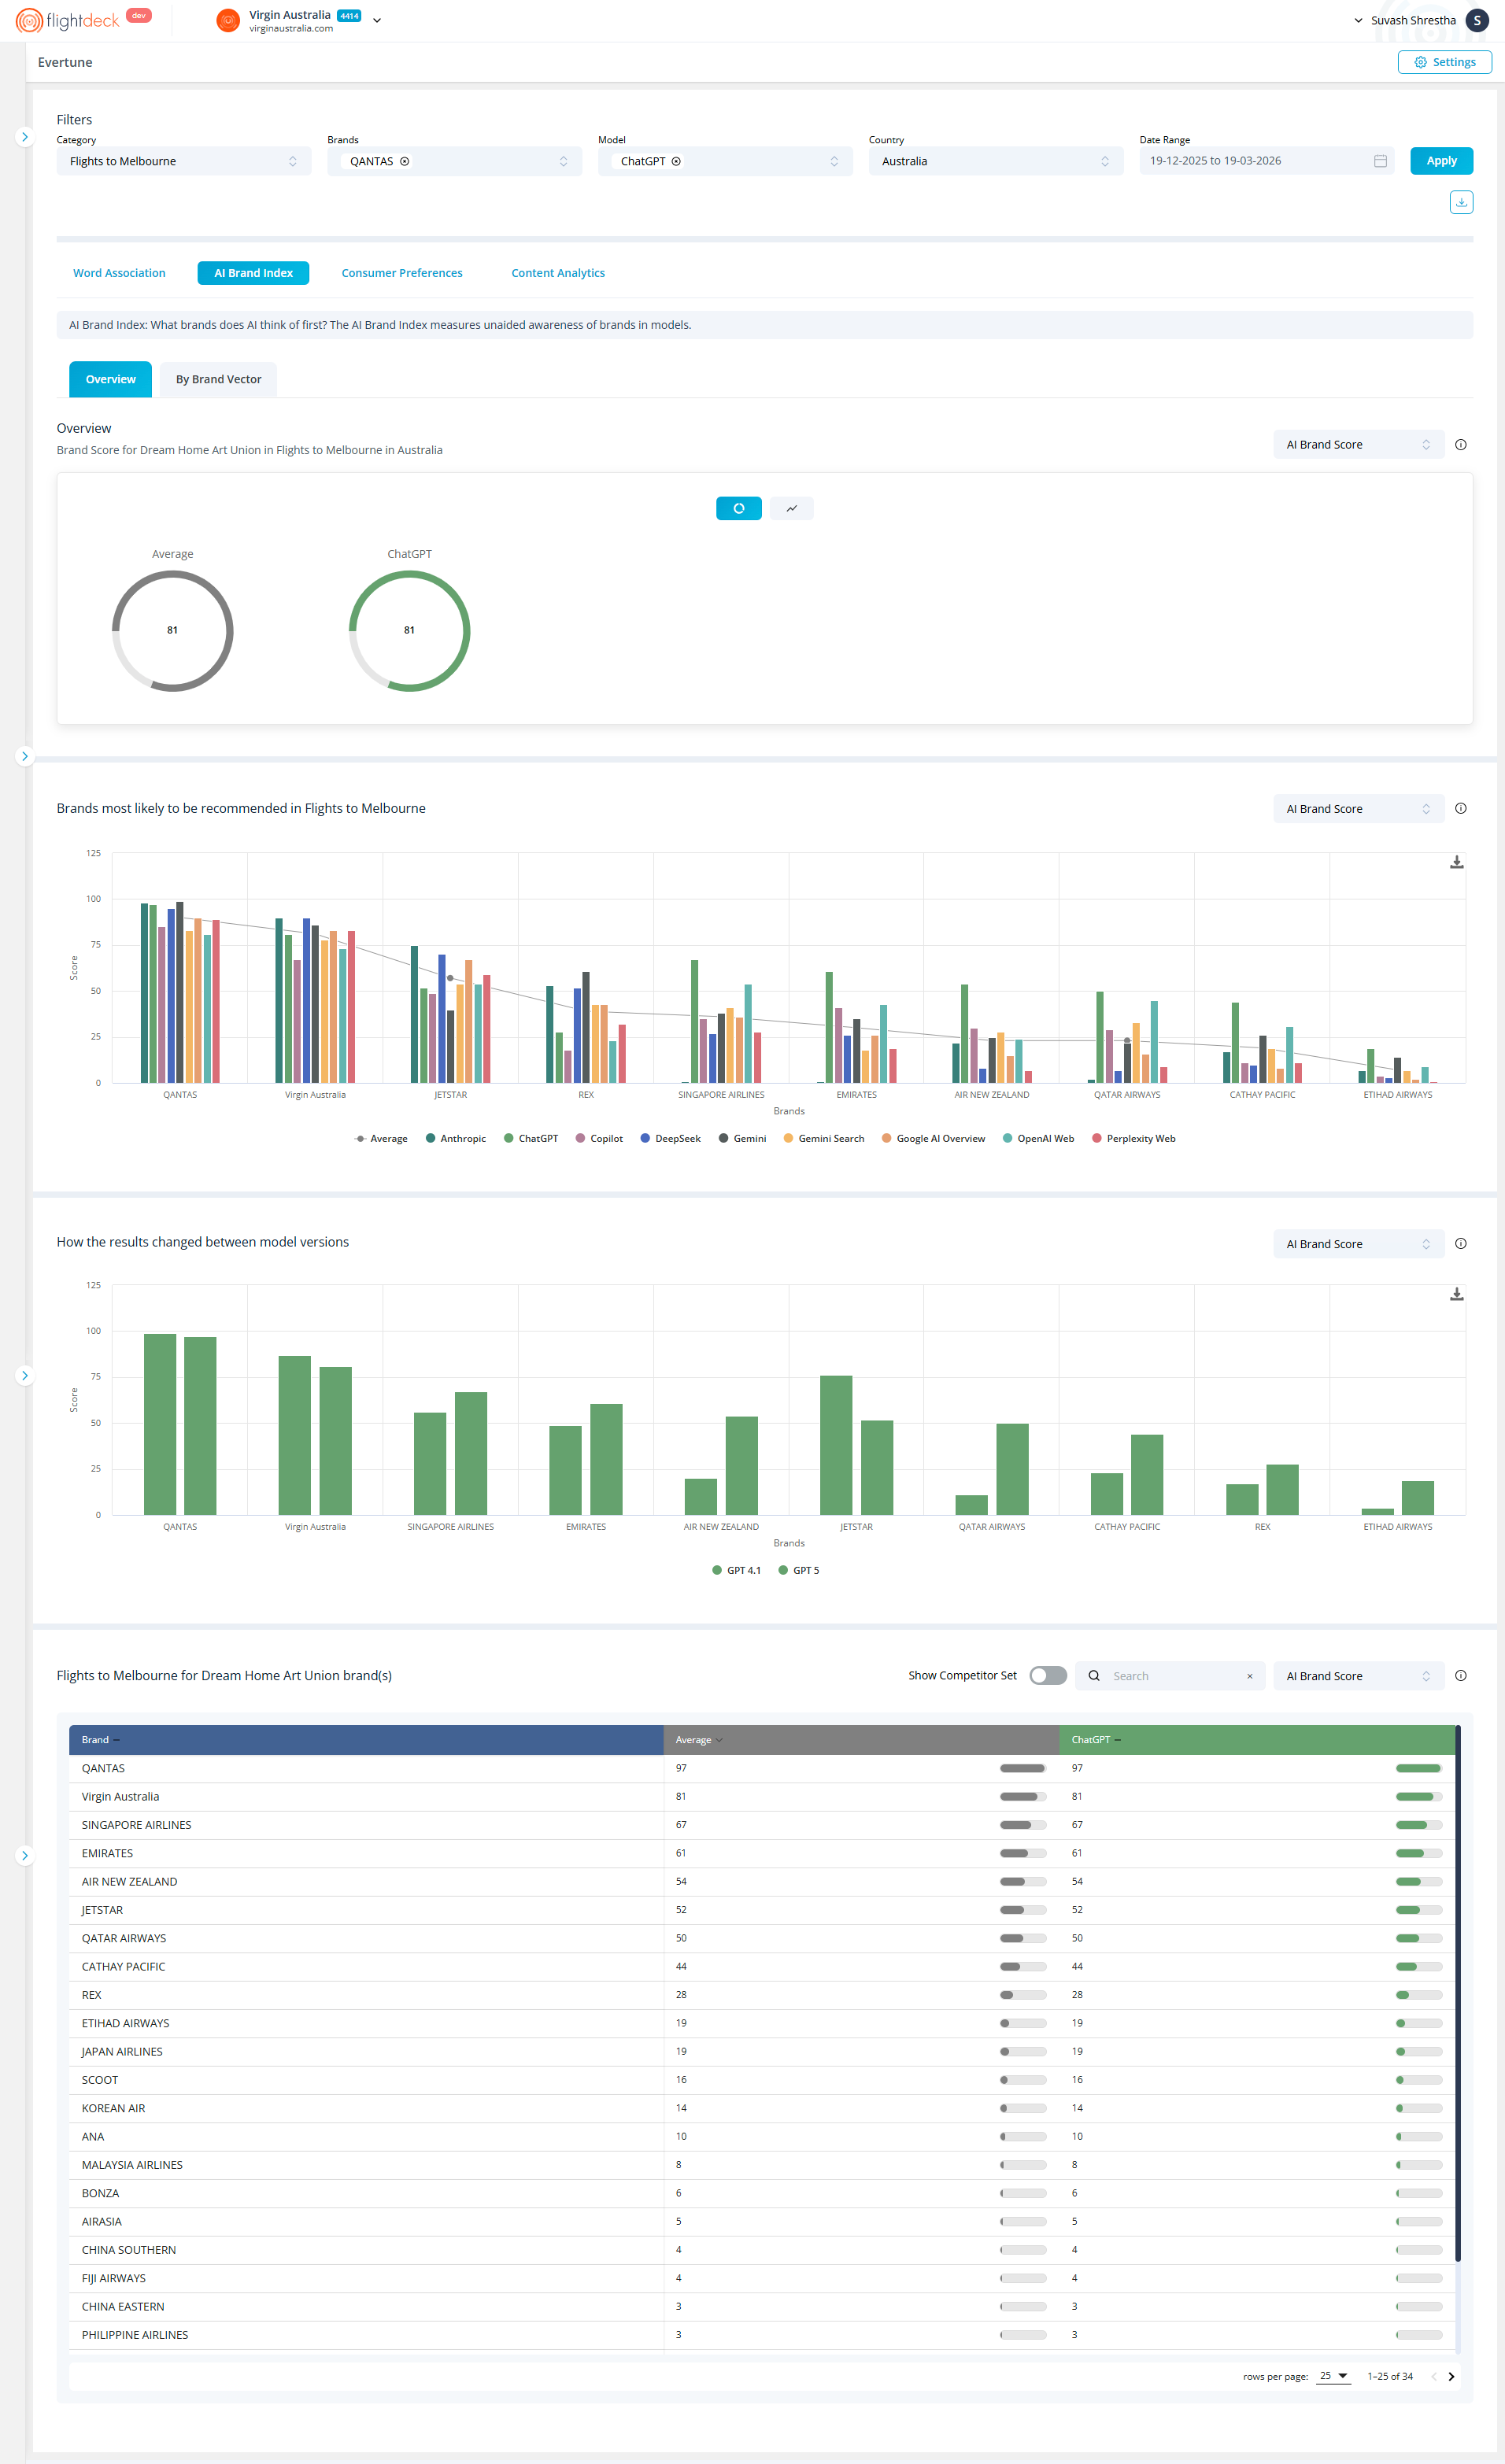
We can view:
- Average Score – Represents the overall brand index score across available models.
- Model-Specific Score (e.g., ChatGPT) – Shows how a specific AI model evaluates or recalls the selected brand.
These indicators help us quickly assess how strongly a brand is recognized by AI.
We can switch between different data views using the visualization toggle available within the Overview section.
- The default view displays summary metrics such as Average Score and model-specific scores using circular indicators.
- By selecting the chart view icon, we switch to a trend visualization, where brand performance is displayed over time in a line chart.
This allows us to:
- Move from a static snapshot to a time-based analysis
- Track how brand performance evolves within the selected date range
- Identify trends, spikes, or changes in brand visibility
All visualizations update based on the selected metric and are influenced by the Global Filters.
Brand Recommendation Distribution
This chart shows how likely different brands are to be recommended within the selected category.
Each brand is represented with scores across multiple AI systems and sources, allowing us to:
- Compare how different AI models rank or recommend brands
- Identify which brands have stronger visibility or recall
- Understand variations in brand preference across AI ecosystems
This helps us evaluate competitive positioning within AI-generated recommendations.
Model versions Comparison
This section highlights how brand scores change across different AI model versions.
- Example comparison:
- GPT 4.1 vs GPT 5
We can use this view to:
- Track how updates in AI models impact brand visibility
- Compare performance between model versions (e.g., GPT variants)
- Identify improvements or declines in brand recall over time
This provides insight into how AI evolution influences brand perception.
Brand Ranking Table
This table provides a detailed ranking of brands based on the selected metric.
Controls
- Show Competitor Set
Toggle to include or exclude competitor brands - Search
Find a specific brand quickly - Metric Selector
Switch between:- AI Brand Score
- Average Position
- Visibility Score
Table Columns
- Brand
List of brands in the selected category - Average
Overall score across models - Model-specific column (e.g., ChatGPT)
Individual model performance - Progress indicators
Visual representation of relative performance
How to Use This Section
We use the Overview tab to:
- Understand overall brand visibility in AI systems
- Compare brands across multiple models
- Identify top-performing and underperforming brands
- Analyze how model changes affect brand ranking
Key Notes
- All values are dependent on Global Filters
- The metric selector changes how performance is calculated
- The Overview provides both summary and detailed comparison
- Data reflects how AI models recognize and recommend brands
By Brand Vector
The By Brand Vector view breaks down brand performance across multiple dimensions, providing a more detailed comparison.
All insights in this view reflect the Global Filters, ensuring that each dimension is evaluated within the selected category, brands, model, country, and timeframe.
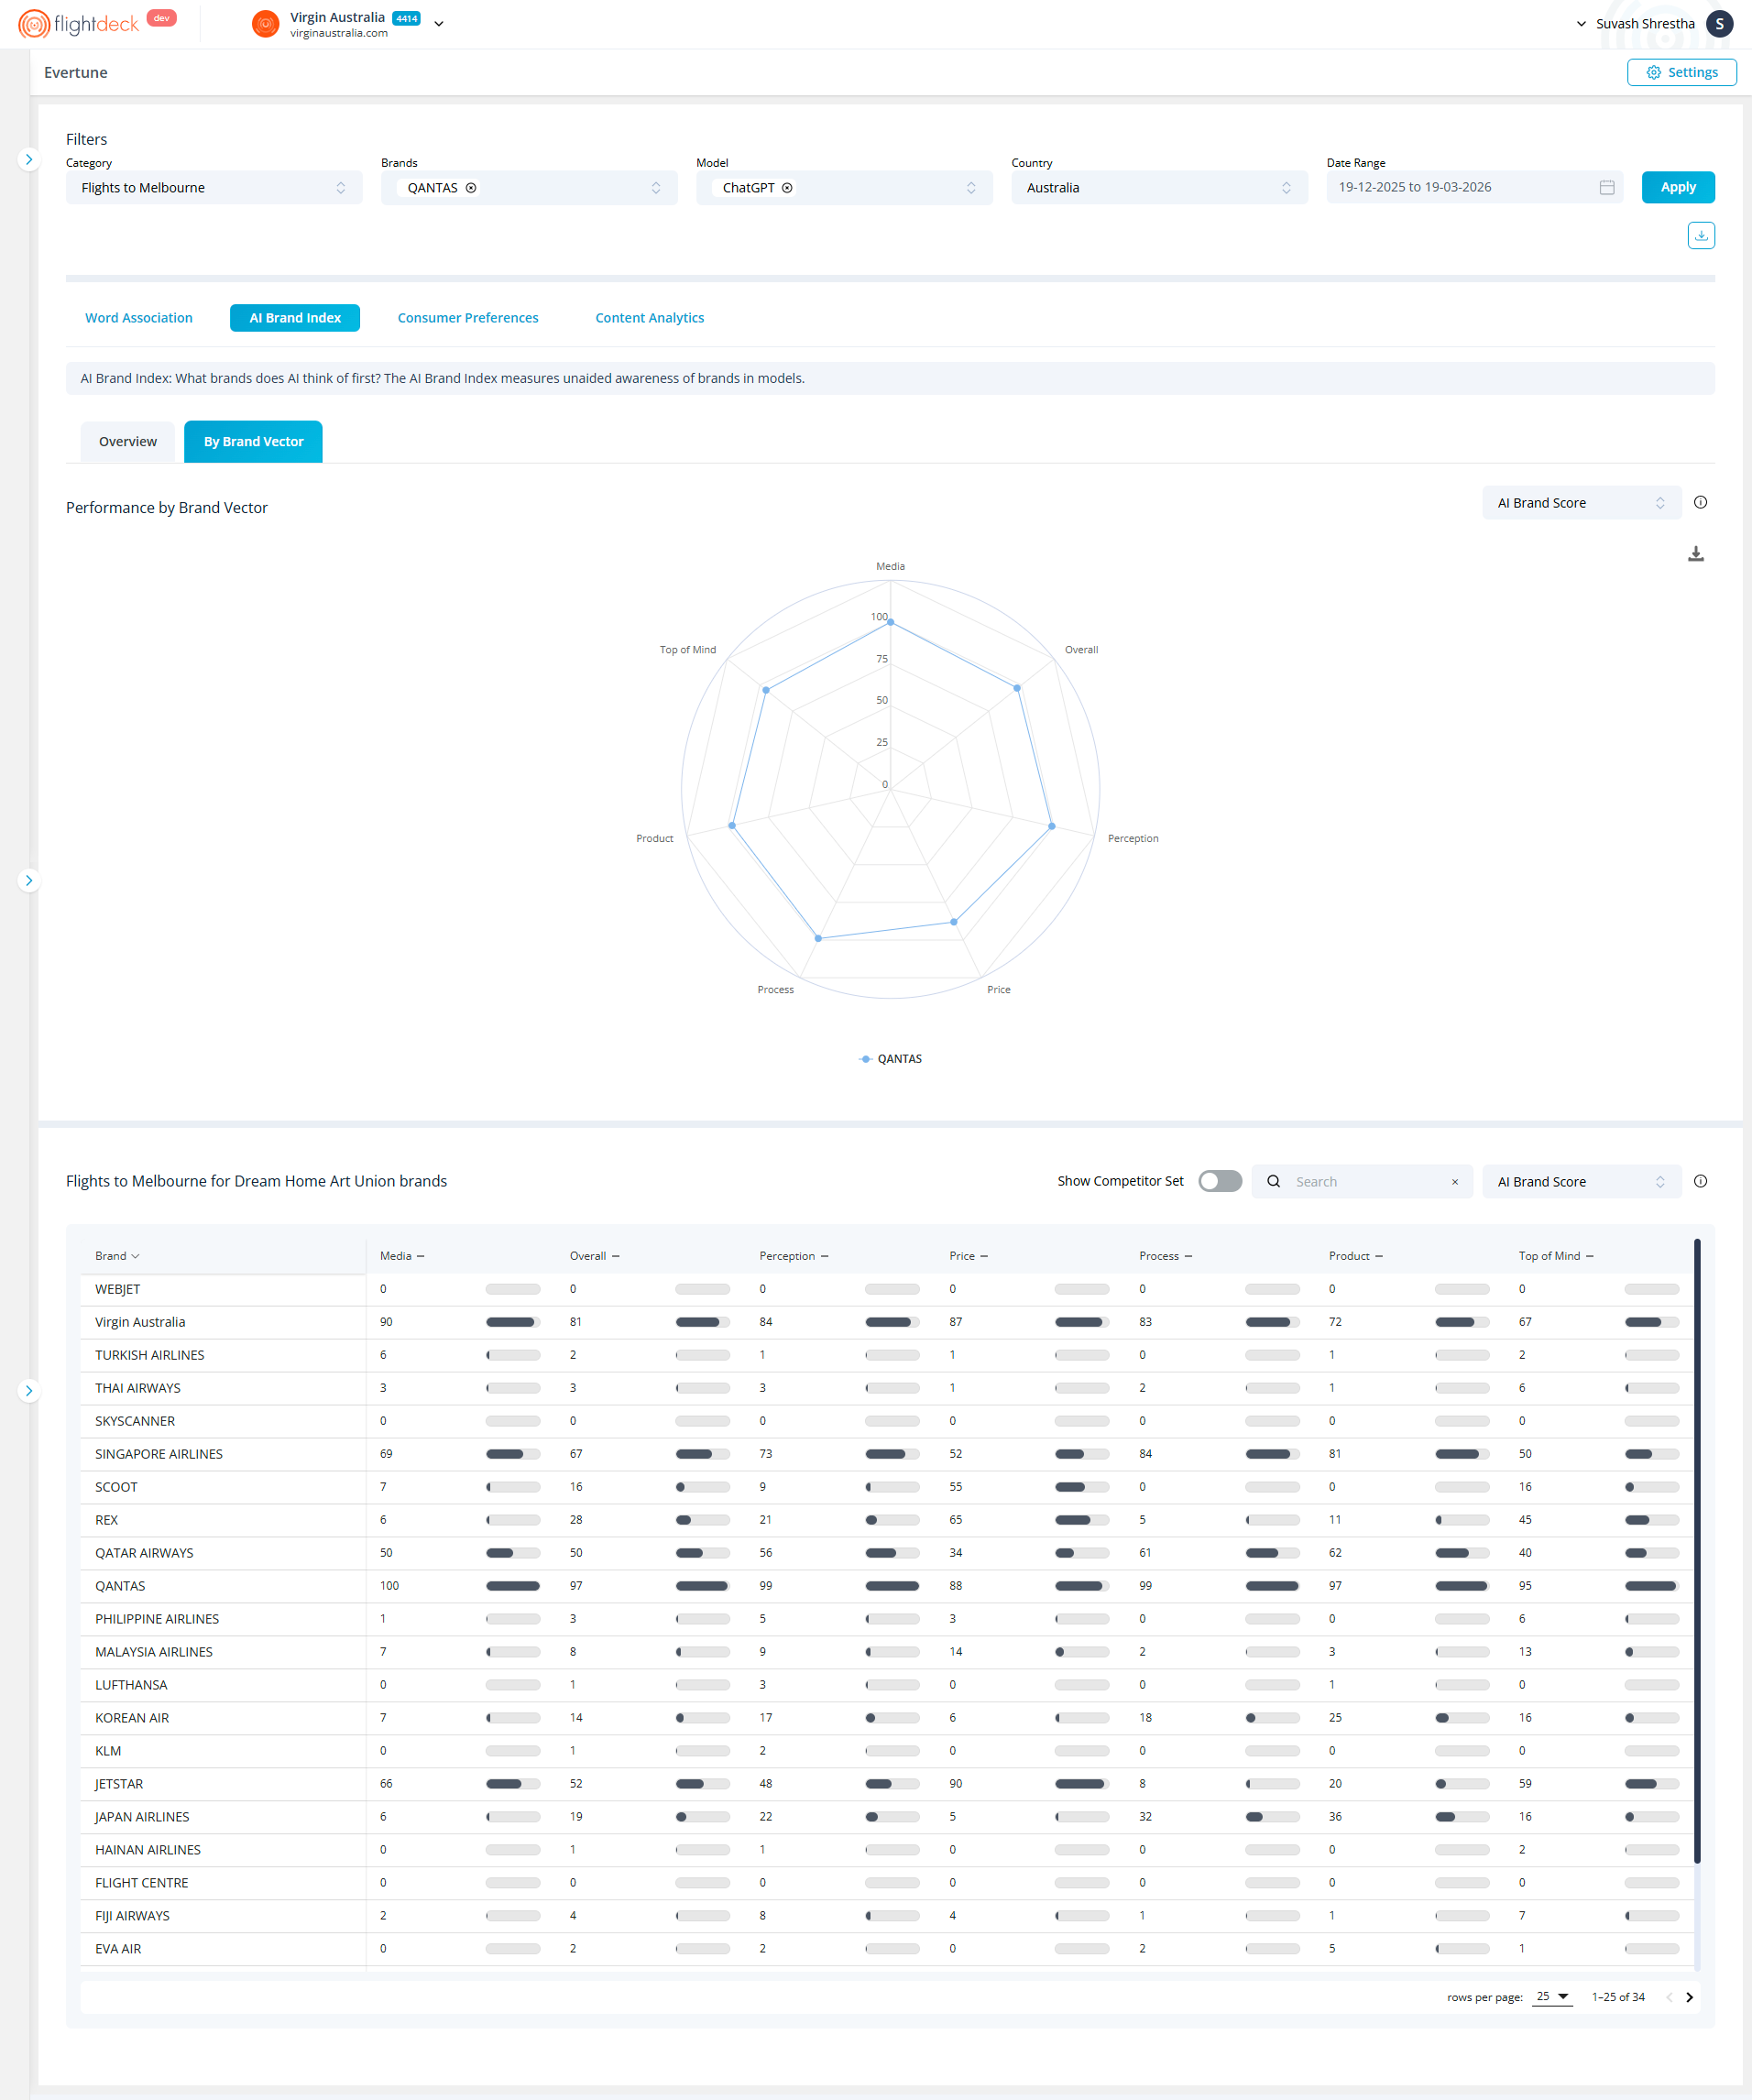
These dimensions may include areas such as:
- Media
- Overall
- Perception
- Price
- Process
- Product
- Top of Mind
Each dimension is plotted across this radar chart, which allows us to:
- Compare strengths and weaknesses across different attributes
- Understand how AI evaluates brands beyond overall scores
- Identify specific areas where a brand stands out or underperforms
This view is especially useful for multi-dimensional brand analysis and competitive benchmarking.
Key Notes
- All values depend on Global Filters
- The metric selector changes how vector scores are calculated
- Each vector represents a distinct dimension of brand evaluation
- This view enables deeper, attribute-level analysis
Consumer Preferences
The Consumer Preferences section shows how AI evaluates brands across key attributes that influence recommendation decisions.
It helps us understand how likely a brand is to be recommended based on factors that AI considers important within a selected category.
All insights are driven by the Global Filters applied at the top of the page.
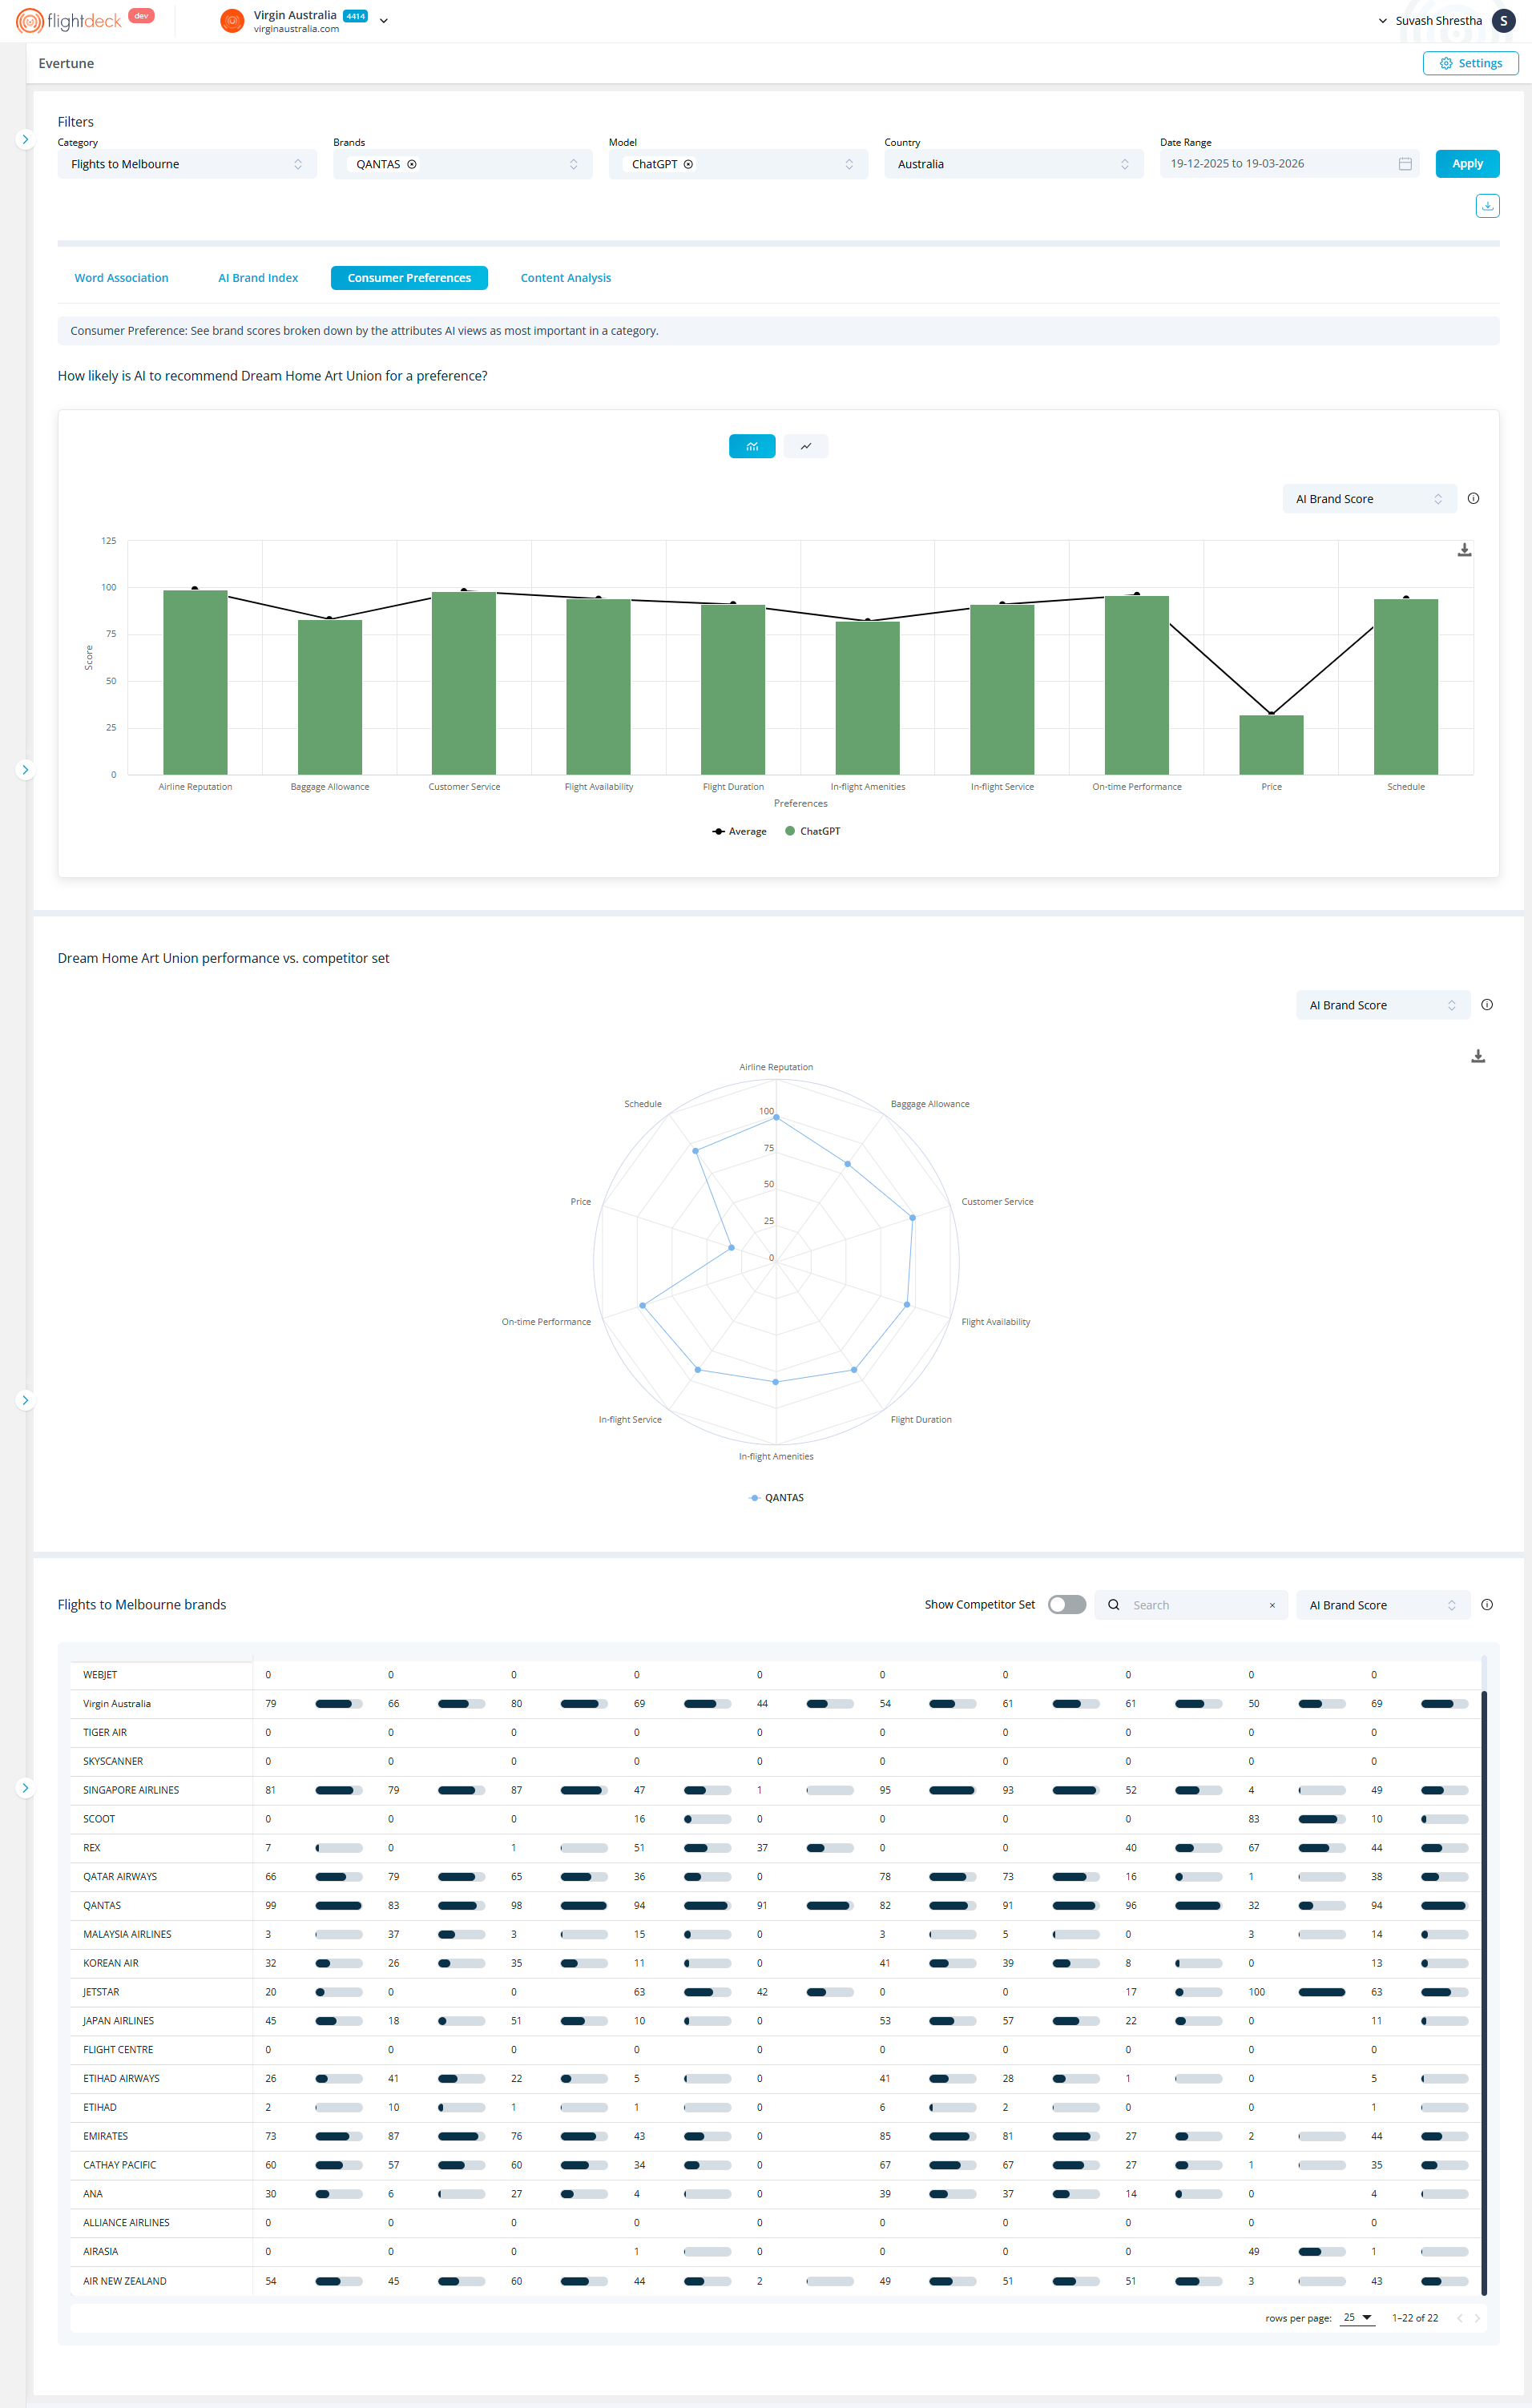
Preference Breakdown
This section displays how likely AI is to recommend a brand based on specific attributes, such as:
- Airline Reputation
- Baggage Allowance
- Customer Service
- Flight Availability
- Flight Duration
- In-flight Amenities
- In-flight Service
- On-time Performance
- Price
- Schedule
The chart includes:
- Bars representing scores from individual AI models
- A line (Average) showing the overall trend across models
This allows us to compare attribute-level performance and identify variations across AI systems.
Visualization Toggle
We can switch between:
- Bars represent scores for the selected model (e.g., ChatGPT)
- The line (Average) shows overall performance across models
Metric Selection
We can use the metric selector (e.g., AI Brand Score) to change how values are calculated and displayed.
All values update based on the selected metric and applied filters.
Brand Comparison Table
This table provides a detailed, attribute-level comparison across all selected brands.
It allows for a more granular analysis beyond visual charts.
How to Use This Section
We use Consumer Preferences to:
- Identify which attributes drive AI recommendations
- Evaluate brand strengths and weaknesses
- Compare performance against competitors
- Support decision-making with attribute-level insights
Content Analytics
The Content Analytics module helps us understand how content is distributed across sources, how much each source contributes, and how accessible that content is to AI systems.
All insights in this module are driven by the Global Filters, and further refined using controls within the module.
Accessing Content Analytics
From the navigation tabs, select Content Analysis
The module opens with two tabs:
- Sources
- AI Education Score
Each tab provides a different perspective on content performance.
Using Global Filters
At the top of the page, we define the dataset using Global Filters:
- Category – Select a single category
- Brand(s) – Select one or multiple brands
- Model – Select a specific model or use average
- Country – Select a country (required)
- Date Range – Define the analysis period
Click Apply to refresh the data.
All charts and tables within Content Analytics update based on these selections.
Data Logic
Content Analytics follows a two-layer data structure:
- Global Filters define the base dataset
- Module-level filters refine the dataset further
This ensures that we always start with a consistent dataset and then narrow it down based on specific analysis needs.
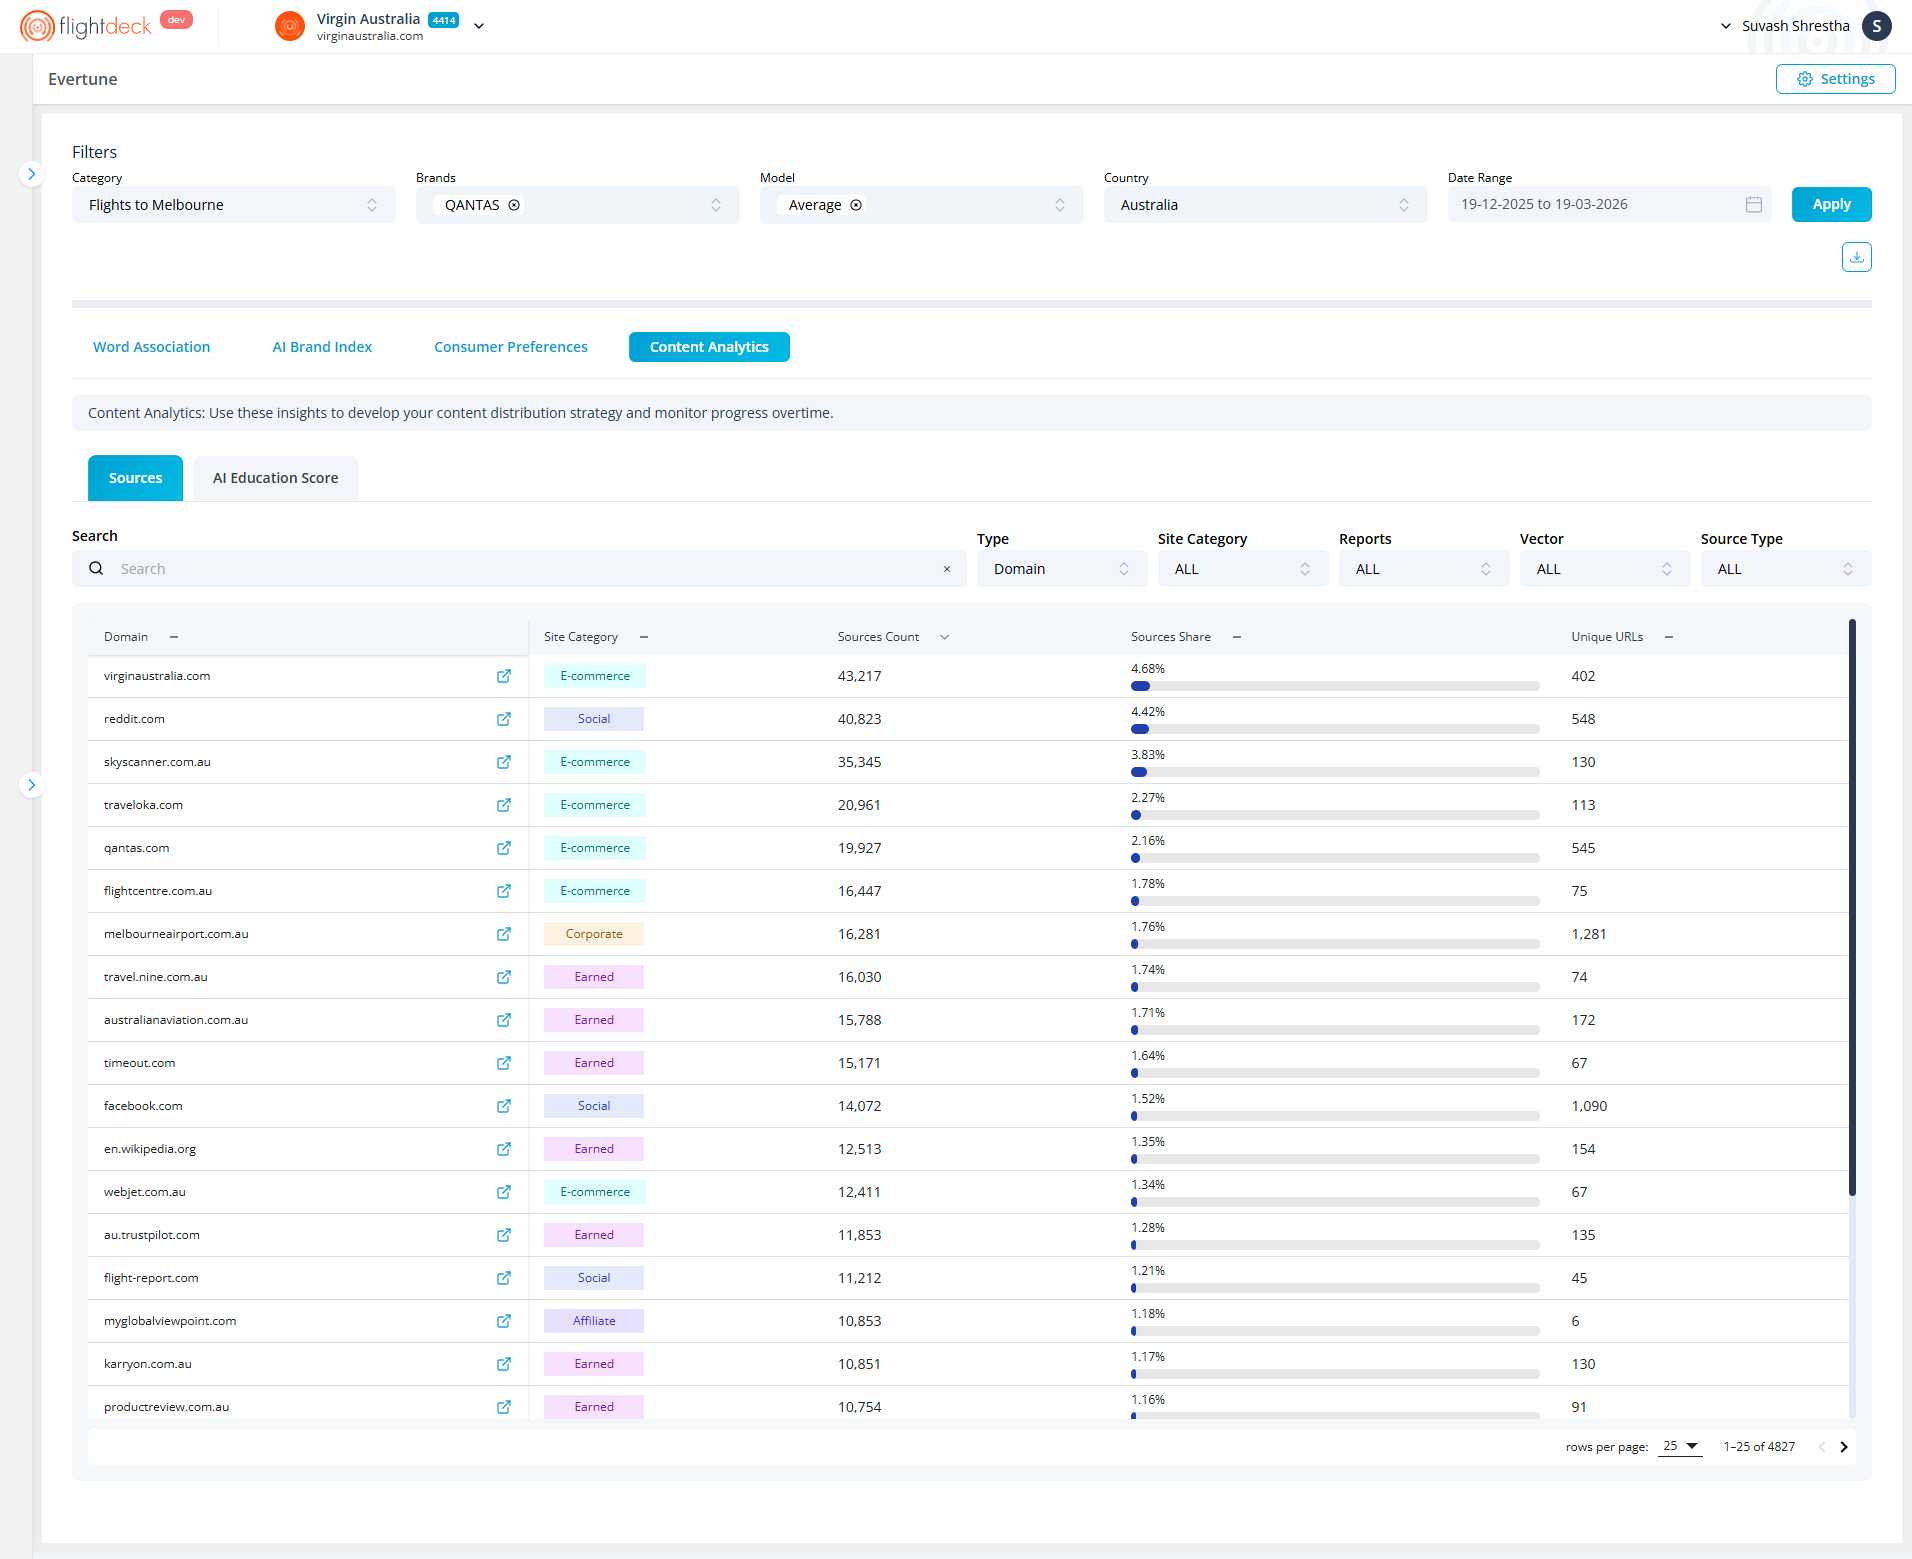
Sources
The Sources tab provides a detailed breakdown of where content is coming from and how each source contributes to overall performance.
Refining Data
We can refine the dataset using the following controls:
- Search
Quickly locate a specific domain by name - Type
Defines the level of analysis (e.g., Domain-level aggregation) - Vector
Selects the attribute or dimension (e.g., Airline Reputation)
This aligns the data with a specific performance factor - Source Type
Filters the origin of content (e.g., Corporate, Earned, E-commerce, Affiliate) - Reports
Selects the reporting context (e.g., Consumer Preferences, AI Brand Index)
Any change in these controls updates the table dynamically.
How Data is Determined
The table data is calculated using:
- Global Filters (base dataset)
- Report + Vector (context + attribute) = Data of Vector
This means:
The Report defines what type of analysis we are viewing
The Vector defines which attribute within that analysis is being measured
Together, they determine the final dataset shown.
Understanding the Table
The table lists content sources and their contribution:
- Domain
The website or platform where content originates - Site Category
Classification of the source (e.g., Corporate, Earned, E-commerce, Affiliate) - Sources Count
Total number of content instances from the source
Indicates content volume - Sources Share
Percentage contribution of the source
Visualized with a progress bar for quick comparison - Unique URLs
Number of distinct URLs contributing to the dataset
AI Education Score
The AI Education Score tab focuses on how content sources interact with AI crawlers and accessibility settings.
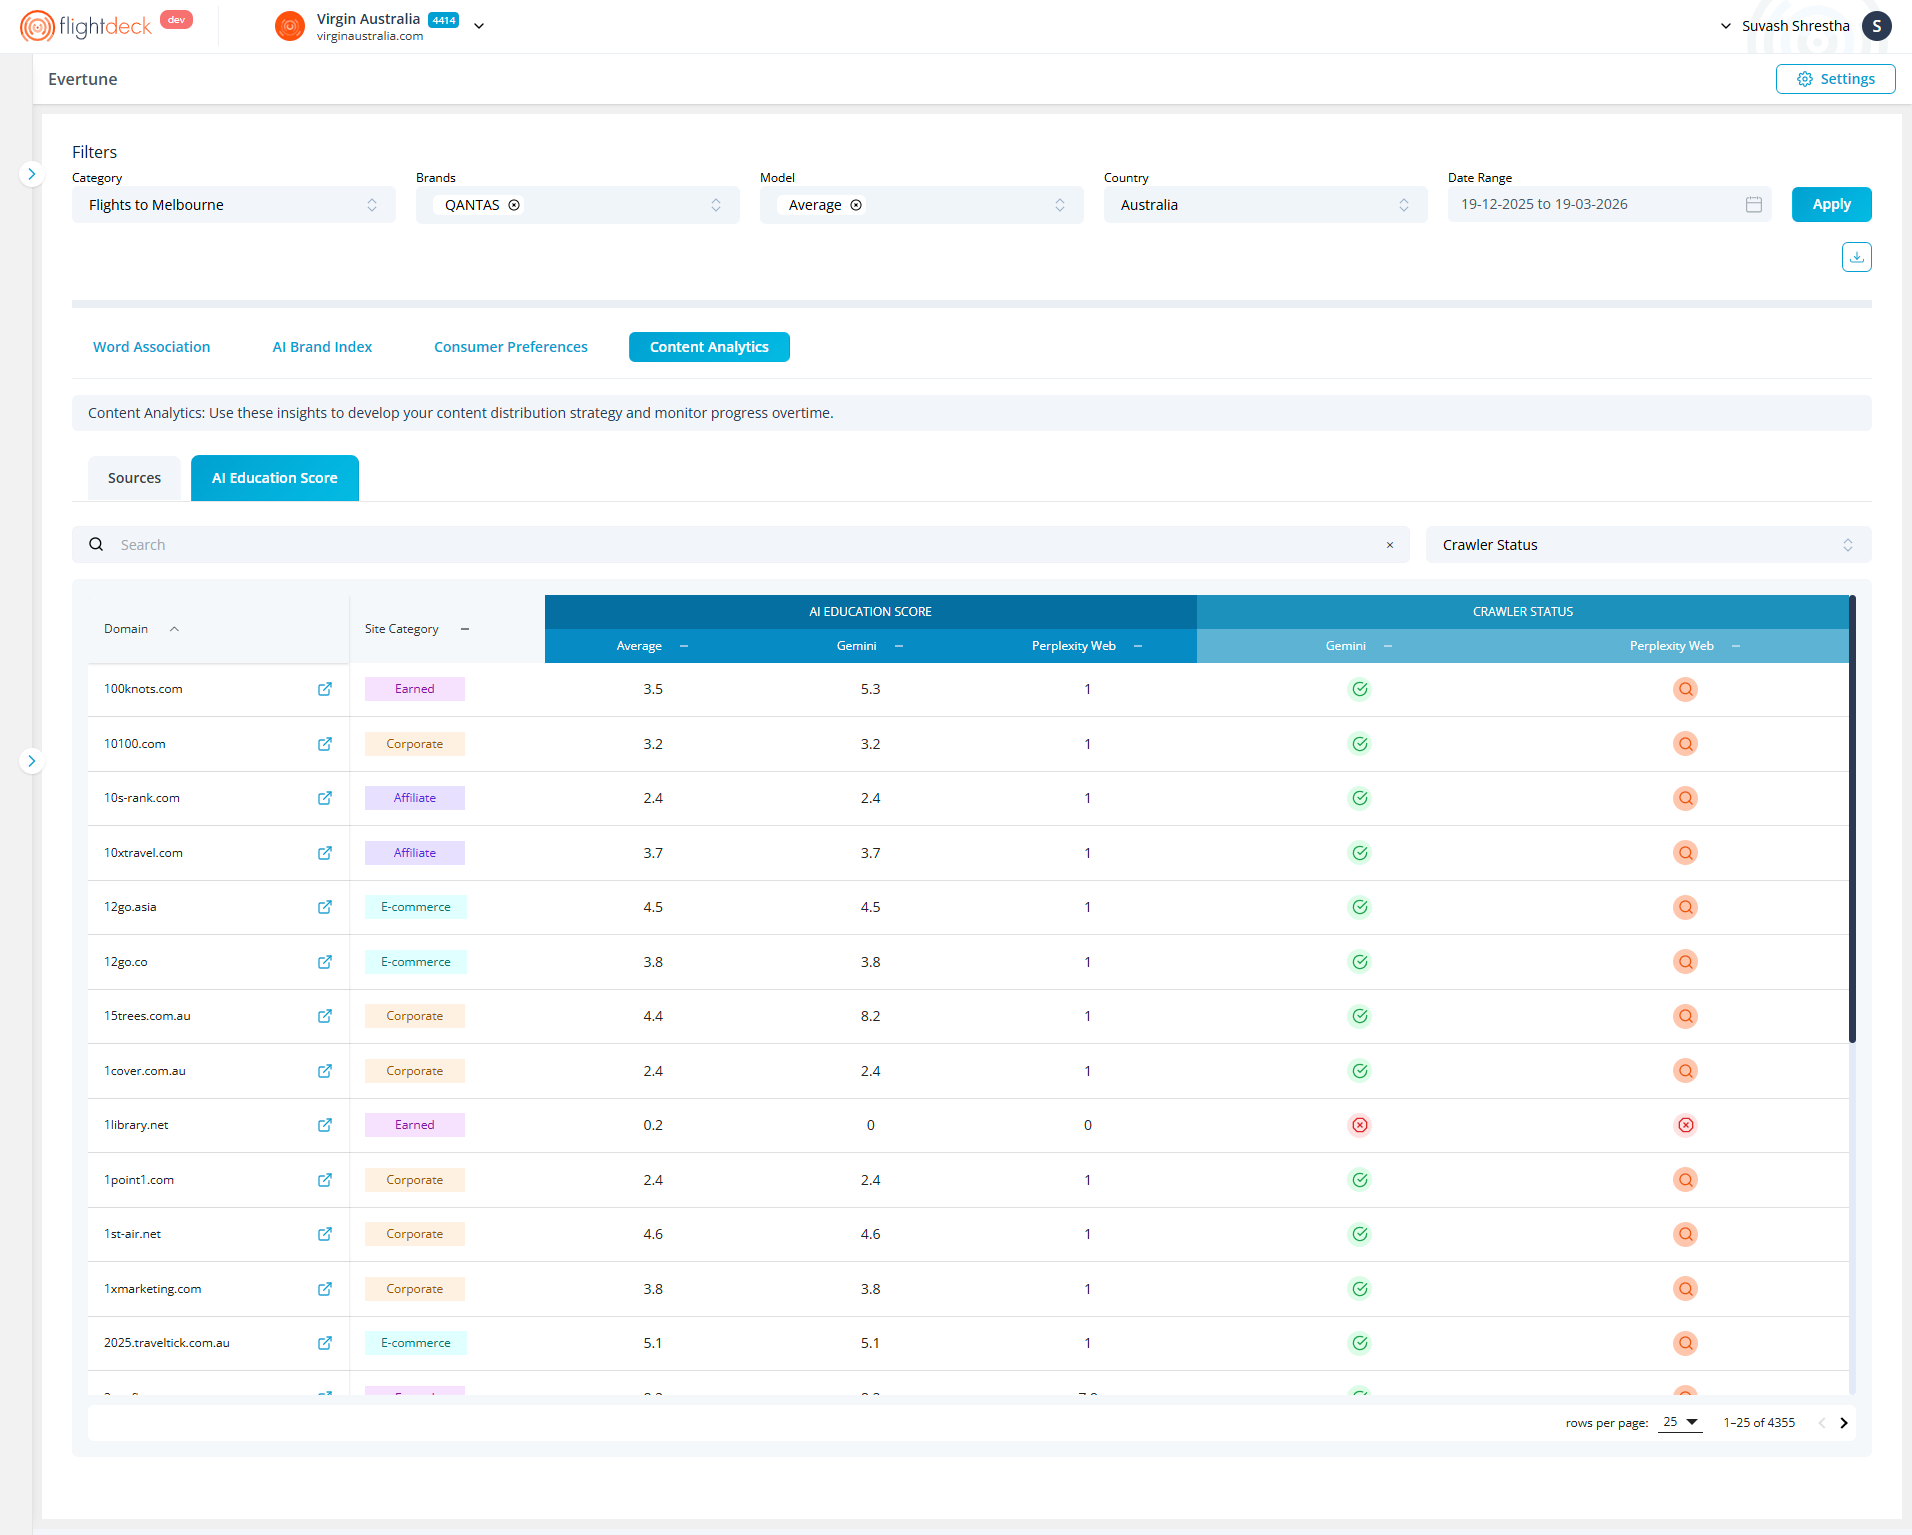
Viewing Crawler Status
Each source includes a crawler status indicator:
- Green Tick (Allowed)
AI crawlers are fully allowed to access content - Search Icon (Partial Access)
Training is restricted, but search access is allowed - Red Cross (Blocked)
All AI crawlers are restricted - Link Icon (Linked/Referenced)
Indicates the presence of crawl-related linking or references
Key Takeaways
- Content Analytics explains content origin, contribution, and accessibility
- Global Filters define the dataset across the module
- Sources tab focuses on contribution and distribution
- AI Education Score tab focuses on crawler accessibility
- Report + Vector determines how data is structured and interpreted